Without Line Breaks
Here's the messy looking example: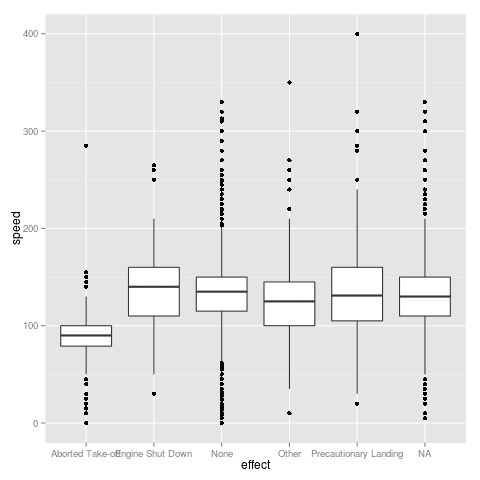 |
| No line breaks in axis labels |
And here's the code for the messy looking example:
library(OIdata)
data(birds)
library(ggplot2)

ggplot(birds,
  aes(x = effect,
    y = speed)) +
geom_boxplot()
With Line Breaks
We can use regular expressions to add line breaks to the factor levels by substituting any spaces with line breaks:
library(OIdata)
data(birds)
library(ggplot2)

levels(birds$effect) <- gsub(" ", "\n", levels(birds$effect))
ggplot(birds,
  aes(x = effect,
    y = speed)) +
geom_boxplot()
 |
| Line breaks in axis labels |
Horizontal Boxes
Here we can see the difference in a box plot with horizontal boxes. It's up to you to decide which style looks better: |
| No line breaks in axis labels |
 |
| Line breaks in axis labels |
library(OIdata)
data(birds)
library(ggplot2)

levels(birds$effect) <- gsub(" ", "\n", levels(birds$effect))
ggplot(birds,
  aes(x = effect,
    y = speed)) +
geom_boxplot() +
coord_flip()
Just a note: if you're not using ggplot, the multi-line axis labels might overflow into the graph.
The code is available in a gist.
