Default
By default,
lattice sorts the observations by the axis values, starting at the bottom left.
For example,
library(lattice)
colors = c("#1B9E77", "#D95F02", "#7570B3")
dotplot(rownames(mtcars) ~ mpg,
 data = mtcars,
 col = colors[1],
 pch = 1)
produces:
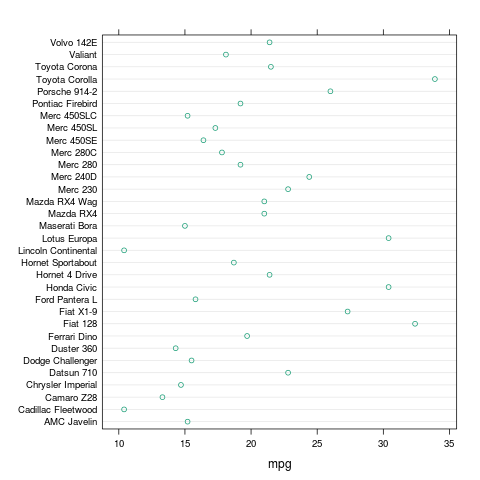 |
| Default lattice dotplot |
(Note: The
rownames(cars) bit is just because of how this data set is stored. For your data, you might just type the variable name (
model, for example) instead.)
Graphing one variable, sorting by another
If we want to show the same data, but we want to sort by another variable (or the same variable, for that matter), we can just add
reorder(yvar, sortvar). For example, to sort by the number of cylinders, we could:
dotplot(reorder(rownames(mtcars), cyl) ~ mpg,
 data = mtcars,
 col = colors[1],
 pch = 1)
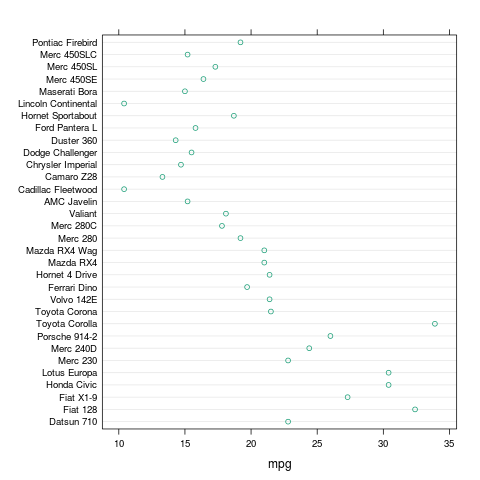 |
| Sorted by number of cylinders |
Graphing two variables
To better show how this works, let's graph
cyl alongside
mpg, so we can see how it is sorting:
dotplot(reorder(rownames(mtcars), cyl) ~ mpg + cyl,
 data = mtcars,
 col = colors,
 pch = c(1, 0))
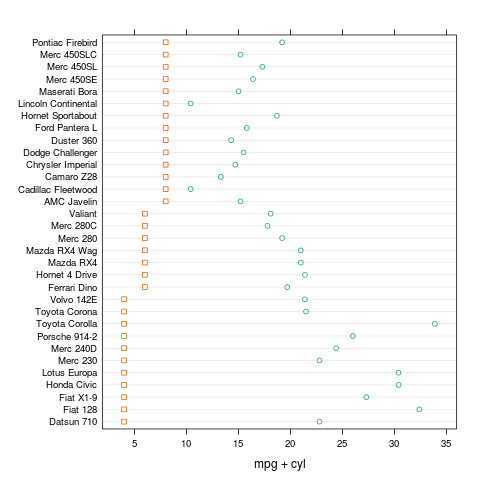 |
| Graph of mpg and cyl, sorted by cyl |
Reverse order
We can also sort in reverse order, by adding a "-" before the variable name:
dotplot(reorder(rownames(mtcars), -cyl) ~ mpg + cyl,
 data = mtcars,
 col = colors,
 pch = c(1, 0))
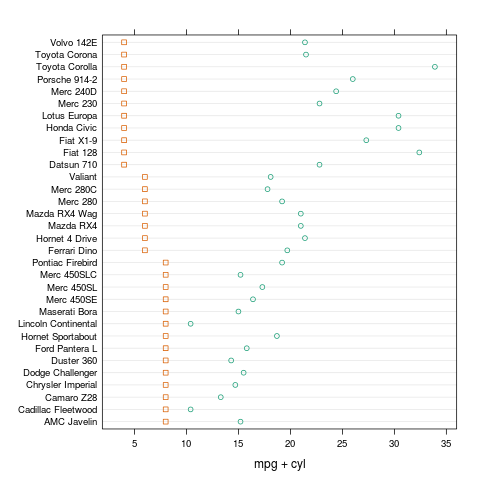 |
| Graph of mpg and cyl, sorted by cyl, reversed |
|
Adding a legend
We can also add a legend:
dotplot(reorder(rownames(mtcars), -cyl) ~ mpg + cyl,
 data = mtcars,
 xlab = "",
 col = colors,
 pch = c(1, 0),
 key = list(points = list(col = colors[1:2], pch = c(1, 0)),
  text = list(c("Miles per gallon", "Number of cylinders")),
  space = "bottom"))
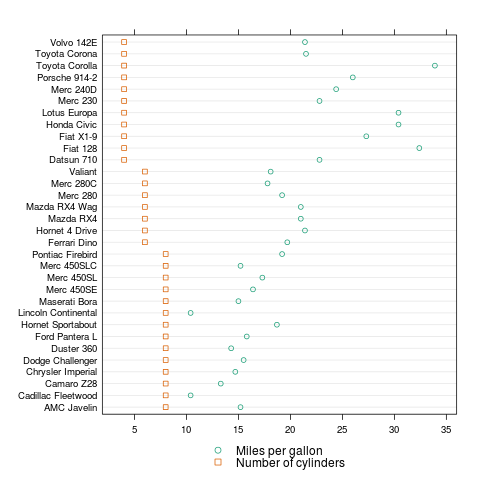 |
| With legend |
Other lattice types
The same technique will work with other lattice graphs, such as barchart, bwplot, and stripplot.
Full code available as a
gist.
Great explanation! This helped me a lot. Thank you...
ReplyDeleteThanks. Very helpful.
ReplyDelete